Recently, I have been completely absorbed by a new topic: data sonification.
My obsession began after listening to an episode of the O’Reilly Hardware Podcast. In the episode, guest Cameron Turner explained how researchers are turning on microphones to collect and analyze sounds coming from things like air conditioner units and commuter trains.
Another example explains how we can take data and convert it into sound. Turner shares the scenario of a data center where the silent internet traffic data is converted into sound to create a system for alerts and monitoring.
If you do a little digging online, you will find all sorts of beautiful examples of data sonification. From the movement of fish to the colors used in famous paintings, data sonification is helping us find new ways to observe the world. In a recent episode of NPR’s Science Friday, you can hear how scientists are developing new ways to use this data analysis technique.
As a science teacher, I often helped students use visual tools, such as graphs and drawings, to understand the data they collected. The chance to add an audio component to help solidify student understanding interests me. I see data sonification as a way for students who are visually impaired to make new observations.
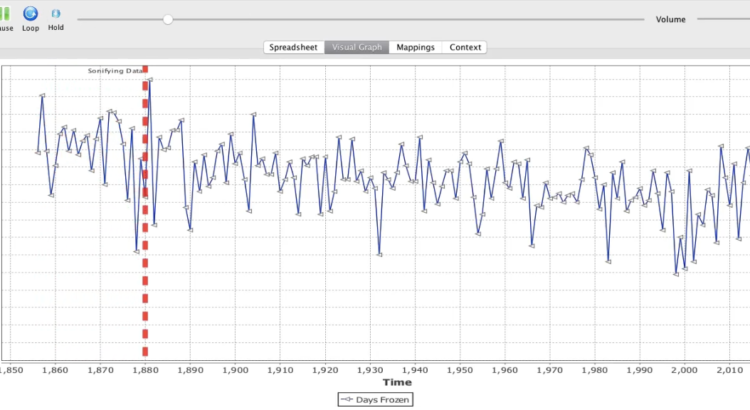
Intrigued by the idea of turning data into sound, I decided to create my own sonifications. I found a free program called Sonification Sandbox that does exactly what I needed.
In the video below, I demonstrate it in action.

 RSS - Posts
Recent Comments